Why turn a Google Sheet into a live dashboard?
If you track tasks, survey replies, sales, or budgets in Google Sheets, a live dashboard lets you see the numbers at a glance and share them without exposing raw cells. With the right no‑code tool, updates to your Sheet flow to charts automatically, so you’re always looking at the latest picture. It’s quick, beginner‑friendly, and ideal for teams, clients, and stakeholders.

This guide shows practical, no‑code paths using popular tools to create a live dashboard from a Google Sheet. We’ll cover a fast, free option using Google’s Looker Studio, plus two alternative “plug‑and‑play” builders you can try. We’ll also call out refresh behaviour and common pitfalls, and link to references so you can go deeper.
Quick win: if you need something shareable in under five minutes, publish a Google Sheet or chart to the web and share the link (File → Share → Publish to web). It’s basic, but it works and updates when the sheet is edited. For a more polished, interactive result, read on. See the “Publish to web” outline described by LiveFlow’s guide on publishing Sheets content for sharing purposes for a quick shareable view of data changes LiveFlow product guide.
What you’ll need
- A Google account with access to Google Sheets.
- A well‑structured Sheet with clean headers and consistent data types.
- A no‑code dashboard tool. You can use:
- Google Looker Studio (free, Google first‑party, no coding).
- A dashboard service that reads Google Sheets directly (e.g., Geckoboard; updates every few minutes and is built for TV/mobile sharing).
- An app builder that can present charts from Sheets (e.g., Glide or similar), if you want mobile‑style experiences.
Tip: If you’re starting from scratch, it can help to collect data with Google Forms so your Sheet stays tidy, or to use a separate “Data” tab and a “Dashboard” tab in the Sheet for calculated fields and named ranges.
Step‑by‑step: Build a live dashboard with Looker Studio (no code)
Looker Studio (formerly Data Studio) is Google’s free dashboard builder. It connects natively to Google Sheets and supports live refresh behaviour. You can share a read‑only dashboard and keep your underlying Sheet private.
Assumptions:
- You’re on a desktop browser and signed into Google.
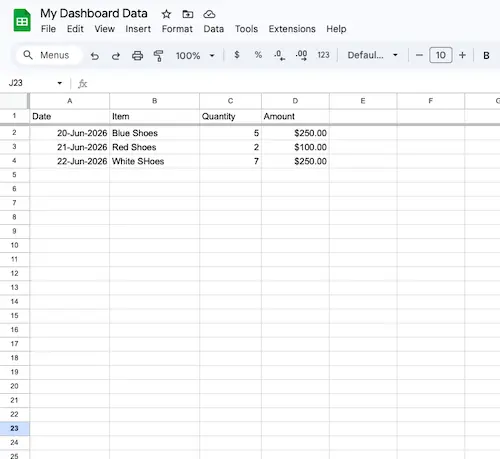
- Your Sheet has a header row and consistent columns (e.g., Date, Category, Amount).
- Prepare your data
- Ensure the first row has clear field names (e.g., “Date”, “Channel”, “Leads”, “Spend”).
- Use consistent date formats in the Date column (preferably YYYY‑MM‑DD).
- Avoid merged cells and blank header names.
- Optional: Create calculated columns in the Sheet for metrics you’ll chart (e.g., CPC = Spend/Clicks).
- Create your Looker Studio report
- Visit Looker Studio and click “Blank Report”.
- Add data source → Google Sheets → pick your spreadsheet and the correct tab. Tick “Use first row as headers”.
- Confirm data types (change any mis‑detected fields, especially Date).
- Build visuals
- Insert a time series chart for main trends (e.g., “Leads over time”).
- Add a scorecard for key KPIs (Total Leads, Total Spend, Conversion Rate).
- Use a bar or pie chart to break down by Category/Channel.
- Add a date range control so viewers can filter by period.
- Make it “live”
- By default, Looker Studio reads the current data from your Sheet. You can set caching/refresh behaviour in Resource → Manage added data sources → your Google Sheets connection. Looker Studio caches data, but will refresh on view; the cache duration and freshness depend on your settings and usage patterns.
- Avoid query‑heavy Sheets functions on every cell; use range formulas or calculated fields in Looker Studio for better performance.
- Share securely
- Click Share → Invite specific people (view‑only) or get a link (for broader access).
- Keep the underlying Sheet access more limited if you don’t want viewers to see raw data.
- If embedding on a site, use the report’s Embed option and set appropriate permissions.
Why choose this path: It’s free, supports filters, date controls, and multiple pages, and it’s tightly integrated with Google Sheets. It’s well‑suited to most beginner and intermediate use cases.
Note: Google’s own documentation covers connectors, field types, and sharing options. While this article doesn’t replicate those docs, the approach above is consistent with Google’s official guidance on connecting Sheets and assembling charts in Looker Studio.
Alternative path 1: Geckoboard (no‑code, built for sharing/TV)
Geckoboard is a drag‑and‑drop dashboard tool with a direct Google Sheets connection. It’s handy when you want a polished, always‑on display for teams, mobile access, and simple scheduling of snapshots. According to Geckoboard’s product page, Google Sheets widgets auto‑refresh “within minutes” (commonly every 3 minutes) Geckoboard Sheets data source page.
How to set up in Geckoboard:
- Link your Google Drive
- In Geckoboard, add a new widget → choose Google Sheets → connect your Google account. It will list Sheets from your Drive.
- Select data ranges
- Choose a Sheet and a named range or specific columns. Keep your header row clean and fixed.
- Pick visual types: number (KPI), line, bar, column, leaderboard, etc.
- Arrange your dashboard
- Drag‑and‑drop tiles, resize, and group related metrics.
- Add separate widgets from multiple Sheets or tabs if needed.
- Set refresh and sharing
- Sheets widgets update automatically every few minutes. If you need near‑real‑time, test with your data scale.
- Share read‑only dashboards by link, set up TV display mode, and configure scheduled email/Slack snapshots.
Why choose this path: Super simple, highly shareable, and great for status boards and teams. Especially good if you’ll put the dashboard on a TV or need quick stakeholder access without training.
Alternative path 2: Glide (no‑code, app‑style dashboards)
Glide turns a Google Sheet into a mobile‑friendly app without code. It’s ideal when you want a dashboard that feels like an app, with lists, charts, and filters, and optional user sign‑in. Glide’s blog outlines creating apps from Sheets that can include dashboards and workflows backed by your spreadsheet. See Glide blog on building apps from Google Sheets.
How to set up in Glide:
- Start a Glide project
- In Glide, choose “From Google Sheets” and connect your Sheet. Glide infers data types and builds basic screens.
- Define your data and computed columns
- Use Glide’s computed columns for ratios, categories, and rollups (e.g., sum by month, average by rep).
- Keep your Sheet tabs tidy; Glide treats each tab as a potential screen/collection.
- Add charts and summary blocks
- Insert chart components to show trends (line, bar, pie).
- Add “Rich text” or “Number” components for headline KPIs.
- Configure filters and visibility
- Add in‑app filters and visibility rules so users see relevant data.
- Optional: Enable user sign‑in and row‑owner rules for per‑user security.
- Publish and share
- Share a link or QR code, or add it to a home screen as a PWA. Updates to the Sheet flow through to the app.
Why choose this path: You want a mobile‑first experience with filters, forms, and optional write‑back (e.g., team members submit updates that land in the Sheet), without coding.

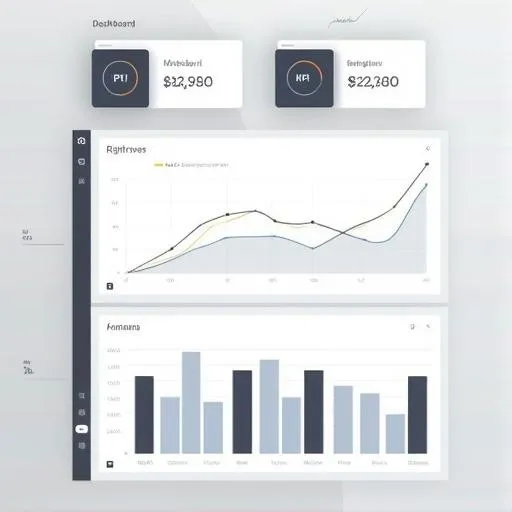
Recommended live dashboard layouts
Focus first on the essentials. A clean layout makes the dashboard more useful and easier to maintain:
- At a glance: 3–5 KPIs at the top (e.g., Total Leads, Conversion Rate, Revenue, Cost, Gross Margin).
- Trends: a time series chart for the main KPI, with a comparison period.
- Breakdowns: a bar or table showing top categories (e.g., Channel, Region, Product).
- Context: a small notes panel stating definitions and last refresh behaviour.
- Filters: a date filter and one key categorical filter (e.g., Channel) to start.
Data refresh and “live” expectations
“Live” usually means the dashboard reflects Sheet changes within minutes. Different tools handle refresh differently:
- Looker Studio: reads current data with caching. Reports refresh when viewed and based on cache settings; heavy Sheets formulas can slow responses.
- Geckoboard: states Google Sheets widgets update every few minutes (commonly ~3 minutes).
- Glide: syncs changes from the Sheet into the app; frequency depends on plan and the type of data operations in play. For most basic use, updates appear shortly after Sheet edits.
If you need near‑real‑time, consider reducing heavy calculations in the Sheet, keeping ranges small, and testing your tool’s refresh pattern with realistic data volume.
Troubleshooting and common pitfalls
- Charts not updating: Check that your Sheet tab name or range hasn’t changed. In tools like Geckoboard, reselect the range or named range. In Looker Studio, open the data source and verify fields and types.
- Wrong data types: Dates detected as text won’t aggregate by week/month. In the Sheet, reformat cells to Date; in Looker Studio, set field types to Date/DateTime.
- Slow dashboards: Replace row‑by‑row volatile formulas with array formulas or pre‑aggregated tables. Move some calculations into the dashboard tool if available.
- Permissions issues: Viewers can’t see the dashboard or data? In Looker Studio, ensure the data source credentials are set correctly and report‑level permissions are set for viewers. In third‑party tools, confirm your Google account connection and sharing settings.
- Big Sheets: Very large spreadsheets can hit performance limits. Consider using summary tabs for the dashboard or moving heavy data to a database later. For simple, direct Sheet dashboards, vendors like Databox and others suggest careful use of functions and filters to keep things responsive; their step sequences emphasise preparing raw data, using key functions, and validating before you chart. See Databox blog on dynamic dashboards in Sheets.
When to consider another approach
- You need sub‑second updates or complex drill‑through: A data warehouse plus BI tool may be better.
- You need to integrate many data sources beyond Sheets: A dashboard platform with multiple native connectors (e.g., the Geckoboard catalogue) can help Geckoboard Sheets data source page.
- You want to publish data while keeping the Sheet private: Looker Studio or a dashboard service is cleaner than sharing the raw spreadsheet. For the fastest publish method straight from Sheets, you can “Publish to web” to get a link that shows charted content and reflects changes as the Sheet updates LiveFlow product guide.
Handy extras
Keyboard shortcuts and small time‑savers:
- Google Sheets: Ctrl/Cmd+Shift+V to paste values only; Ctrl/Cmd+; to insert today’s date; Alt/Option+Shift+K to open data validation quickly (via menu search).
- Looker Studio: Duplicate charts to reuse styles; use the theme panel for consistent colours.
For mixed operating systems:
- Windows and macOS browsers both work fine with Looker Studio and third‑party dashboard tools.
- If you run Linux, most tools work well in Chromium/Chrome or Firefox.
Wrap‑up
You don’t need to write a single line of code to turn a Google Sheet into a live, shareable dashboard. For most beginners, Google Looker Studio is the best starting point: it’s free, flexible, and easy to share. If you want a polished “status board” that auto‑refreshes every few minutes and looks great on TVs or mobiles, try a purpose‑built dashboard tool like Geckoboard. And if you want the dashboard to feel like a mobile app with filters and forms, Glide is a friendly choice.
Start small: define 3–5 KPIs, build a simple layout, and test your refresh behaviour. Once you’re comfortable, add more charts and filters. If you want to go further, explore our related guides on data organisation and performance monitoring.
Context and further reading:
- Publishing a simple live view from Google Sheets (“Publish to web”) and sharing options: see the walkthrough referenced in the LiveFlow product guide LiveFlow product guide.
- Auto‑refresh behaviour and ease of sharing dashboards powered by Google Sheets: see Geckoboard’s Sheets integration overview Geckoboard Sheets data source page.
- Stepwise thinking about dynamic dashboards and preparing your data/functions before charting: Databox’s guide on building dynamic dashboards in Google Sheets Databox blog on dynamic dashboards in Sheets.
Also worth noting: while some blogs show how to assemble dashboards directly inside Sheets, these often involve more manual work and less polished sharing. A live, no‑code dashboard tool makes the ongoing experience smoother for non‑technical users.